- GCode and Part Programs
- O Codes (subroutines) and NGCGUI
- Unsure of next step - Read file data in NGCGUI?
Unsure of next step - Read file data in NGCGUI?
- cts1085
- Offline
- Senior Member
-

Less
More
- Posts: 50
- Thank you received: 1
22 Mar 2014 01:19 - 22 Mar 2014 01:26 #45047
by cts1085
Unsure of next step - Read file data in NGCGUI? was created by cts1085
I am working on recreating some of Dewey Garrett's excellent work.
I have built a XZC lathe and have it working with LinuxCNC - I can make threads, helix designs, OD/ID tapers, etc.
I can probe a shape along the z-axis to get the various points (offsets) on the x-axis. (from a manually turned object)
This results in a file with X,Z pairs. (logfile.txt)
How can i read this data to manipulate or create a rotational g-code output that leverages the profile measured by the probe routine?
Say to overlay a repeating or geometric design on the measured surface?
Thank you for any guidance!
Last edit: 22 Mar 2014 01:26 by cts1085.
Please Log in or Create an account to join the conversation.
- newbynobi
-
- Offline
- Platinum Member
-

Less
More
- Posts: 1931
- Thank you received: 394
22 Mar 2014 05:06 #45071
by newbynobi
Replied by newbynobi on topic Unsure of next step - Read file data in NGCGUI?
This will not be possible. As your routine will need to now if the points shoud be a line or an arc.
So take a CAD, enter the points and tell the CAD what geometrie should cover thd points, but be aware, that you probing results will contain geometric errors.
Than take a CAM to generate the gcode.
Norbert
So take a CAD, enter the points and tell the CAD what geometrie should cover thd points, but be aware, that you probing results will contain geometric errors.
Than take a CAM to generate the gcode.
Norbert
Please Log in or Create an account to join the conversation.
- cts1085
- Offline
- Senior Member
-
Less
More
- Posts: 50
- Thank you received: 1
22 Mar 2014 20:39 #45098
by cts1085
Replied by cts1085 on topic Unsure of next step - Read file data in NGCGUI?
Thank you for your reply.
In my case since this is on a lathe so I will know that the points are in a line with variances caused by the curvature of the turned object. The probed points will be along the side of the piece with the C-Axis at zero and the minZ to maxZ being the top and bottom of the probed area. The X values would be the radius of the piece at each Z probed point.
Does this make sense?
What I am trying to accomplish is something similar to what Dewey Garrett accomplished during this video:
-- Full credit to Dewey Garrett for this idea! --
Please Log in or Create an account to join the conversation.
- cts1085
- Offline
- Senior Member
-
Less
More
- Posts: 50
- Thank you received: 1
30 Mar 2014 19:43 #45415
by cts1085
Replied by cts1085 on topic Unsure of next step - Read file data in NGCGUI?
Just in case people are following this...
I have found a solution.
Utilizing the python widgets that can run from Axis I leveraged some of the routines from this site that do the following;
1) Read in the probe data into a list (Now I have a sorted list of Z, X data points)
2) Write a general purpose script to do some design - i.e. a sine wave around the piece
3) As the script is generating the G-Code lookup the X value (Radius) from the probe data based on the current Z value - averaging between points if needed.
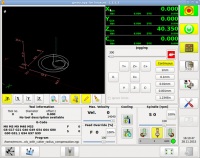
4) It works! I can even visualize the generated G-Code in Axis to determine if i have issues with my widget -
Many thanks to those who contribute on this site - this is an awesome environment!
-Tom
I have found a solution.
Utilizing the python widgets that can run from Axis I leveraged some of the routines from this site that do the following;
1) Read in the probe data into a list (Now I have a sorted list of Z, X data points)
2) Write a general purpose script to do some design - i.e. a sine wave around the piece
3) As the script is generating the G-Code lookup the X value (Radius) from the probe data based on the current Z value - averaging between points if needed.
4) It works! I can even visualize the generated G-Code in Axis to determine if i have issues with my widget -
Many thanks to those who contribute on this site - this is an awesome environment!
-Tom
Please Log in or Create an account to join the conversation.
- GCode and Part Programs
- O Codes (subroutines) and NGCGUI
- Unsure of next step - Read file data in NGCGUI?
Time to create page: 0.101 seconds