Todd,
I'm just a small time hobby machinist making things out of wood for friends and family. I used to run faster ('faster' for me anyway....maybe 1,500mm/min and increased accelerations to match) but I kept ruining bearings on my X axis. I chalked this up to the weight of the Z-Axis riding on the X-axis rails, and that the larger forces imposed by the increased acceleration were probably causing 'some' amount of damage. How much I'm not sure, but I can run my little machine about a year between bearing changes when using a max around 420mm/min but I start getting (what I call) "bearing drag" after about 2 months at the higher speeds. The plastic at the ends of the bearings starts tearing apart, so that when moving in one direction the bits of plastic would ride up into the bearing, then when moving the other direction the axis had to overcome the force to get past it and the axis would 'jump' about 1mm resulting in all kinds of horrible looking things any time the axis reversed direction. Long story short, for my poor man's machining budget it doesn't bother me if it takes 10x as long to finish something, my machine utilization rate is probably about 5% over the course of a year anyway. But not to worry -> I'm saving up my pennies for one of these fancy metal milling machines with those (crazy!) velocity rates. I will be there one day...
Anyway, back to our discussion:
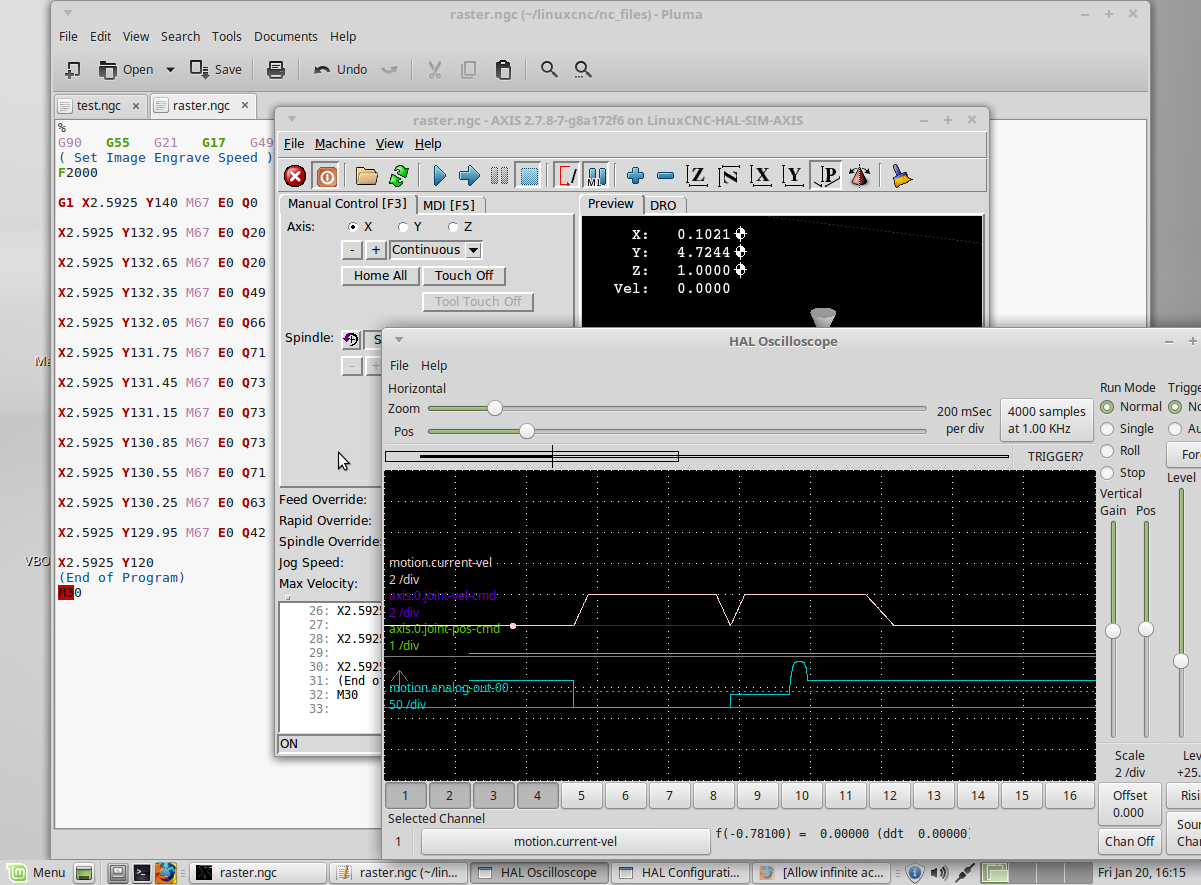
Will it tell you what the velocity is dropping to when it executes that 2nd y-move code (with Q20)? I see a sharp point there where it looks like velocity drops considerably and then shoots back up. Based on the rest of the graph that looks like the v=0 point. If that is actually what's happening in your simulator then that would be somewhat similar to how mine keeps dropping off somewhat near the same point.
If I was good with halscope we could probably figure out if they were dropping off at precisely the same time. The remainder of the difference in your velocity graph and mine could then be summed up in acceleration rates most likely. My graph takes the long slow journey towards velocity = 0 because my acceleration values are so low. In your simulated mode your accel values are probably >>> greater than mine, hence the reason yours can drop to zero and recover within such a short time.
It could be my eyes playing tricks on me, but your graph appears to follow the same acceleration rate (linear velocity increase) during "movement start" and the quick (what I am calling) v=0 point of your graph, although the deceleration rate at the v=0 point is not the same as your ending deceleration rate; potentially interesting but for another discussion.