Probe Calibration Plots
- fletch
-
 Topic Author
- Offline
- Premium Member
-

Less
More
- Posts: 140
- Thank you received: 72
12 Feb 2024 19:11 #293162
by fletch
Probe Calibration Plots was created by fletch
As per my post
here
, I am building a resistance switching probe interface, with a side project (for reasons) of a
Mostly Printed Probe
... To compare the performance of the resistance interface board (and the probe) with my previous 'straight switching' setup, I'd like to automate the creation of plots like
these
by Alex Lait (@ZincBoy). The automation is required because (once I get the PCBs back), I will be 'tuning' some of the resistor switching values - so lots of rinse & repeat...
I got very excited that even though Alex appears to be offline for 6 months, he had a probe macro github repository - but unfortunately that was for RS274 based probes.
If anyone (Alex, if you're back online?) can point me in the right direction, any help would be appreciated.
I got very excited that even though Alex appears to be offline for 6 months, he had a probe macro github repository - but unfortunately that was for RS274 based probes.
If anyone (Alex, if you're back online?) can point me in the right direction, any help would be appreciated.
Please Log in or Create an account to join the conversation.
- Mecanix
- Offline
- Platinum Member
-

Less
More
- Posts: 447
- Thank you received: 228
12 Feb 2024 20:05 - 12 Feb 2024 20:07 #293165
by Mecanix
Replied by Mecanix on topic Probe Calibration Plots
If this is for accurate probe mechanical & electrical engineering purposes, this is done by indexing the probe in the spindle, or in a fixture that runs true, and measured against a fixed/mounted micrometer. You can't automate this with a xy table (mechanical errors too great). If calibration is required for production that is another story, mechanical errors of that specific machine-tool needs to be accounted for.
Last edit: 12 Feb 2024 20:07 by Mecanix.
Please Log in or Create an account to join the conversation.
- fletch
-
Topic Author
- Offline
- Premium Member
-
Less
More
- Posts: 140
- Thank you received: 72
12 Feb 2024 20:21 - 12 Feb 2024 20:31 #293169
by fletch
Replied by fletch on topic Probe Calibration Plots
Thanks Mecanix - this really for comparison - in particular the effect of using resistance switching on the shape of the lobe.
My cunning plan was/is to use my 20mm diameter calibration ring - which (in theory) should provide a set of points as an offset +/- 10mm from a theoretical centre. My interest is in comparing the different setups - straight switched vs resistance switched and alternate variables in the resistance switching PCB. The (in)accuracies in X/Y of the machine would hopefully remain consistent for all tests.
I realise at some point I will have to use a micrometer to test the absolute accuracy (rather than the comparative) but that will happen when I have a better understanding of the monster I have created.
Last edit: 12 Feb 2024 20:31 by fletch.
Please Log in or Create an account to join the conversation.
- Mecanix
- Offline
- Platinum Member
-
Less
More
- Posts: 447
- Thank you received: 228
12 Feb 2024 20:41 - 12 Feb 2024 20:48 #293170
by Mecanix
Replied by Mecanix on topic Probe Calibration Plots
The one I use for prod-calibration is a simple known bore size script (180degree). It will automate the calib and save your runout in the tool table (see X, Y, Front, Back) and offset that from your production measurements accurately - accurate/effective enough to reveal that a 20mm probe shaft length is deflecting less than a 40mm one anyway. And so that method should be a good starting point in my opinion.
github.com/hausen8/EasyProbe/blob/v1.3/m...robe_calibration.ngc

github.com/hausen8/EasyProbe/blob/v1.3/m...robe_calibration.ngc
Last edit: 12 Feb 2024 20:48 by Mecanix.
The following user(s) said Thank You: tommylight, fletch
Please Log in or Create an account to join the conversation.
- fletch
-
Topic Author
- Offline
- Premium Member
-
Less
More
- Posts: 140
- Thank you received: 72
12 Feb 2024 21:17 #293172
by fletch
Replied by fletch on topic Probe Calibration Plots
Thank you very much - after starting to learn FreeCAD macros over the weekend, it might be LinuxCNC macros next weekend!
Please Log in or Create an account to join the conversation.
- MaHa
- Offline
- Platinum Member
-
Less
More
- Posts: 533
- Thank you received: 235
13 Feb 2024 23:17 - 17 Feb 2024 12:22 #293276
by MaHa
Replied by MaHa on topic Probe Calibration Plots
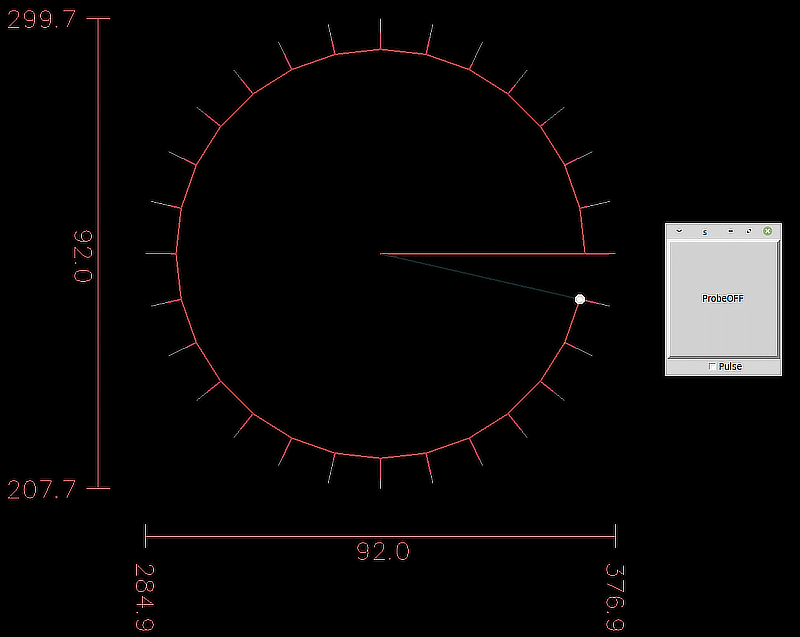
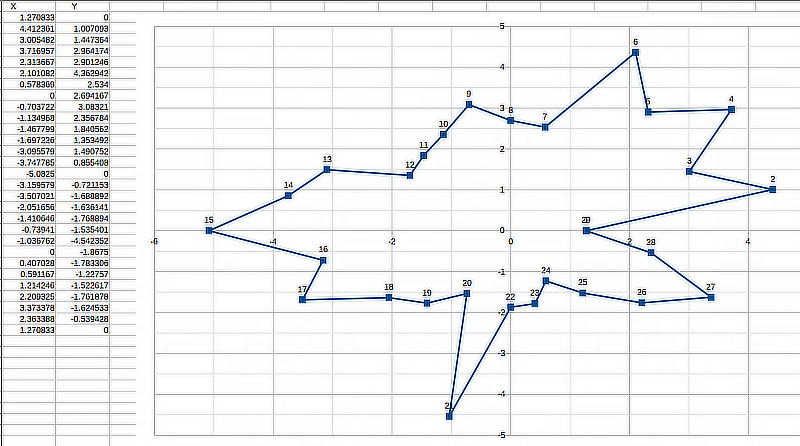
For my probe calibration, i use only 4 quadrants, it's enough. Just to see how the homemade probes behave, i have this routine. First setup calibration ring with dial gauge, set X0 Y0. Some settings can be done in the file, also the path for the logfile. The Logfile is overwritten at programstart. Make a copy first, or change LOGOPEN to LOGAPPEND. It contains tab-separated xy results. The first result is also append last, for close the line in calc. The probe tip is compensated from tooltable. In Calc, i made xy-lines diagram. Once its there,just need to replace Data. Its so simple, not much to say.
Last edit: 17 Feb 2024 12:22 by MaHa. Reason: Replaced old .ngc file with most recent Version from my machine
The following user(s) said Thank You: fletch
Please Log in or Create an account to join the conversation.
- fletch
-
Topic Author
- Offline
- Premium Member
-
Less
More
- Posts: 140
- Thank you received: 72
17 Feb 2024 11:51 #293606
by fletch
Replied by fletch on topic Probe Calibration Plots
Oh wow - thank you Markus, this looks perfect.
Please Log in or Create an account to join the conversation.
- fletch
-
Topic Author
- Offline
- Premium Member
-
Less
More
- Posts: 140
- Thank you received: 72
19 Feb 2024 12:31 - 19 Feb 2024 12:42 #293756
by fletch
Replied by fletch on topic Probe Calibration Plots
Well, we have pretty pictures. Do they mean anything? Probably not but the consistency from the
Mostly Printed Probe
is fascinating. Yes, I'm using backlash compensation. Yes, my machine is probably only accurate to 0.05mm (but repeatable to less) - so how on earth am I so consistently measuring my 20mm calibration ring? With a 3D printed probe! It does help that the stylus is very short and the probe's contacts are fairly wide, but still... Answers on a postcard or sealed down envelope, please!
This is a 'net' chart (LibreOffice's equivalent to a polar chart, I think) - I modified Markus' .ngc to report polar distance and to return to the centre each time to try to mitigate the backlash compensation. Probing speed was 75mm/min.
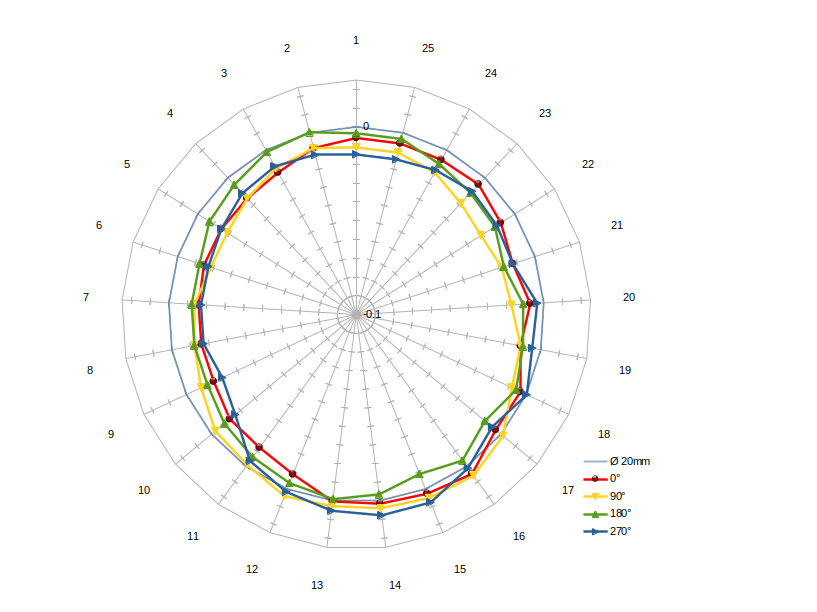
The concentric markings on the chart are 0.01mm - my measurement of the ruby ball on the stylus is probably a little off as I'm fairly consistently measuring under size.
My methodology was pretty crude as I was more trying to make LibreOffice do it's thing than do real measuring. I turned the probe by 90° for each run and re-centred it using the standard probe screen. I've attached the individual plots if of interest, and the output data is below.
So, next steps? Definitely worth investing the time to do it properly - dial in stylus concentricity, use a micrometer etc. Just need to find the energy...
This is a 'net' chart (LibreOffice's equivalent to a polar chart, I think) - I modified Markus' .ngc to report polar distance and to return to the centre each time to try to mitigate the backlash compensation. Probing speed was 75mm/min.
The concentric markings on the chart are 0.01mm - my measurement of the ruby ball on the stylus is probably a little off as I'm fairly consistently measuring under size.
My methodology was pretty crude as I was more trying to make LibreOffice do it's thing than do real measuring. I turned the probe by 90° for each run and re-centred it using the standard probe screen. I've attached the individual plots if of interest, and the output data is below.
So, next steps? Definitely worth investing the time to do it properly - dial in stylus concentricity, use a micrometer etc. Just need to find the energy...
Last edit: 19 Feb 2024 12:42 by fletch. Reason: Code that looked good in preview looked terrible in reality
The following user(s) said Thank You: tommylight
Please Log in or Create an account to join the conversation.
- MaHa
- Offline
- Platinum Member
-
Less
More
- Posts: 533
- Thank you received: 235
19 Feb 2024 12:44 #293758
by MaHa
Replied by MaHa on topic Probe Calibration Plots
Did you use the updated routine, i replaced in my post? I realized, the version on my machine is very different to my archive, and more recent. There is also the angle and radius logged. Just be careful with offsets and g43 set as i used it.
The following user(s) said Thank You: fletch
Please Log in or Create an account to join the conversation.
- fletch
-
Topic Author
- Offline
- Premium Member
-
Less
More
- Posts: 140
- Thank you received: 72
19 Feb 2024 12:50 - 19 Feb 2024 18:23 #293759
by fletch
Replied by fletch on topic Probe Calibration Plots
Ah, no - I didn't notice the update (too busy learning gcode!). Attached is my modified version of your original, annotated a bit because this is really the first hand-coded gcode I have run! I did run it on a sim first though...
I'll download your updated version and compare notes - it has been a really useful learning tool, so thank you very much.
I'll download your updated version and compare notes - it has been a really useful learning tool, so thank you very much.
Last edit: 19 Feb 2024 18:23 by fletch.
Please Log in or Create an account to join the conversation.
Time to create page: 0.179 seconds